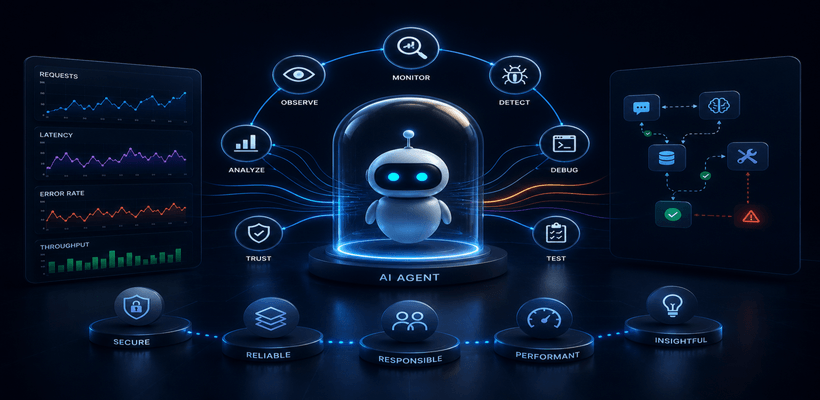
A support team deployed an autonomous agent to handle refund requests. For three weeks, it worked exactly as designed. Then a routine API update changed the shape of a response object, and the agent started approving refunds against a policy it had misread. Nobody caught it for four days, because nothing had crashed. The agent was still returning valid, confident, well-formatted answers. It was simply wrong.
This is the failure mode that makes autonomous agents different from every other piece of software a team has shipped. An agent can complete a task, log a success, and still have made a decision that no one would sign off on. Catching that gap requires more than uptime checks and error logs. It requires AI agent observability: the ability to see, test, and debug what an agent actually did and why at every step in production.
What AI Agent Observability Actually Covers
AI agent observability is the practice of capturing and analyzing the full decision trail of an autonomous agent, including its inputs, reasoning steps, tool calls, memory state, outputs, latency, and cost. The goal is knowing why it chose one action over another, where a multi-step task went off track, and whether its behavior today still matches its behavior last week.
This differs from standard application monitoring in a specific way. A server either responds or it does not. An agent can respond correctly in form and incorrectly in substance, and no HTTP status code will flag that. Agent monitoring has to operate at the level of meaning.

Why Standard APM Tools Miss Agent Failures
Application performance monitoring tools were built for deterministic systems: a request arrives, code runs the same way each time, and a response goes out. Autonomous agents break that model in four specific ways.
Non-determinism. The same input can produce different reasoning paths and outputs across separate runs, making traditional “expected output” testing unreliable on its own.
Multi-step execution. A single user request can trigger a dozen or more internal calls: a retrieval step, a planning step, several tool invocations, and a final synthesis. A failure in step three can look identical to success until step ten.
Semantic failure. An agent can return a fully formed, policy-compliant-looking answer that is factually wrong. The refund example above is a semantic failure, not a technical one, and standard error tracking has no mechanism to catch it.
Emergent behavior. Agents with memory and planning capabilities can develop patterns that were never explicitly coded, which makes some failures difficult to reproduce on demand.
These four gaps are why teams running agents in production need a dedicated observability layer built specifically for LLM-based systems.
The Three Pillars of Agent Observability
1. Tracing: Recording the Full Decision Path
Every agent action should produce a trace that includes the system prompt, the retrieved context, each tool call and its result, any retries, token counts, and the final output. This is often called agent tracing or LLM tracing, and it is the foundation on which everything else depends.
A complete trace lets an engineer reconstruct exactly what the agent had in front of it at the moment it made a decision. Without that record, debugging a failure is guesswork. With it, the exact step where reasoning diverged becomes visible.
2. Evaluation: Testing Continuously, Not Once
AI agent testing cannot stop at launch. Model updates, prompt edits, and new patterns in live traffic all shift agent behavior over time, a practice teams often call continuous or online evaluation. A practical evaluation setup includes:
- A golden dataset of known inputs and expected outputs, used to regression-test every prompt or model change.
- LLM-as-judge scoring, where a separate model grades outputs against defined criteria at scale.
- Human review on a sampled percentage of live traffic, particularly for decisions with financial or legal weight.
- Task success rate tracking measures whether the agent completed the assigned multi-step task rather than merely producing a plausible response.
Evaluation works as an ongoing test suite that runs alongside production traffic, not a checklist completed before launch and forgotten.
3. Monitoring: Real-Time Signals Built for Agents
Live agents need dashboards and alerts tuned to failure modes that generic uptime monitoring will never surface. The metrics worth tracking include:
- Hallucination rate: how often the agent produces factually incorrect or fabricated output.
- Tool call failure rate: how often a tool invocation errors out or returns an unexpected result.
- Latency per step and end-to-end, since agents chaining multiple calls accumulate delay quickly.
- Token cost per completed task, since an agent stuck in a retry loop can burn through budget with no visible error.
- Loop-and-retry detection, flagging an agent that repeats the same failed action.
- Guardrail trigger rate, showing how often safety or policy filters intervene.
Alerts should fire on shifts in these numbers. A rise in retries or a drop in task success rate is usually the first sign of trouble, well before anything technically breaks.
Debugging Autonomous Agents in Production
When a failure surfaces, the quality of AI agent debugging depends entirely on what was already captured. A workable process looks like this:
- Replay the exact trace. Pull the captured prompt, context, and tool responses rather than inferring the original conditions.
- Isolate the failure point. Use the step-by-step trace to determine whether the break happened during retrieval, reasoning, tool execution, or output formatting.
- Check context handling. Many apparent reasoning failures are actually due to context truncation or weak retrieval.
- Compare against the golden dataset. Run the same input through the evaluation suite to determine if this is an isolated case or a broader regression.
- Fix, then re-run the full suite. A patch to one prompt or tool can introduce a new regression elsewhere in the chain, so re-testing before redeployment is not optional.

Building an Observability Stack for AI Agents
A production-grade agent observability stack generally includes an instrumentation layer that captures traces and metadata from every agent step, often built on OpenTelemetry extended for LLM calls; a storage system built to handle large, nested trace data. An evaluation engine combining rule-based, model-graded, and human review scoring. Dashboards with alerting thresholds set to the team’s actual risk tolerance and replay tools that let engineers test historical traces against new prompts or models before rollout.
Teams can build this internally using open standards or adopt one of the observability platforms designed specifically for agentic systems. The right choice depends on how much internal engineering capacity is available versus how quickly the team needs coverage in place.
Practices Worth Adopting Early
Instrument the agent from the first deployment. Adding observability after an agent is already live and handling real tasks is considerably harder than building it in from day one. Log the reasoning behind a decision. Version every prompt, tool definition, and model so that a behavior change can be traced to a specific deployment.
Set success criteria at the task level, since a fast wrong answer is still wrong. Sample production traffic for human review on a regular basis, since automated evaluation will not catch every failure mode that a team hasn’t anticipated yet. Treat every failure trace as data that improves the next version of the prompt or tool design.
Frequently Asked Questions
1) What is AI agent observability?
AI agent observability helps teams monitor and understand how AI agents make decisions. It tracks reasoning, tool usage, and outputs to identify errors, hallucinations, and performance issues.
2) How does agent observability differ from standard application monitoring?
Traditional monitoring focuses on uptime, latency, and system errors. Agent observability goes deeper by evaluating reasoning quality, decision accuracy, and AI-specific behaviors.
3) What tools support AI agent monitoring?
Teams commonly use tracing frameworks, evaluation platforms, observability dashboards, and OpenTelemetry-based tools. These help track agent performance, tool usage, and response quality.
4) How do teams debug a failing AI agent in production?
Teams review captured traces, prompts, and tool interactions to locate the source of failure. This helps determine whether the issue comes from retrieval, reasoning, or external tools.
5) Why does agent testing need to run continuously instead of once before launch?
AI agents can change behavior due to model updates, prompt modifications, or new user inputs. Continuous testing helps detect regressions and maintain reliable performance over time.
Why Choose [x]cube LABS?
[x]cube LABS works with enterprise teams to design and deploy AI agents across complex, regulated environments.
We help enterprises become AI-native, not by adding AI on top of existing systems, but by rebuilding the intelligence layer from the ground up. With 950+ products shipped and $5B+ in value created for clients across 15+ industries, here is what we bring to the table:
1. Autonomous AI Agents
We design and deploy agentic AI systems that sense, decide, and act without human bottlenecks, handling complex, multi-step workflows end-to-end with measurable resolution rates and no manual intervention.
2. Enterprise Voice AI
Our voice AI platform, Ello, puts production-ready voice agents in front of your customers in minutes. Zero-latency conversations across 30+ languages, with no call centers and no wait times.
3. AI-Powered Process Automation
We replace manual, error-prone workflows with intelligent automation across invoicing, compliance, customer service, and operations, freeing your teams to focus on work that requires human judgment.
4. Predictive Intelligence and Decision Support
Using machine learning and real-time data pipelines, we build systems that forecast demand, flag risk, optimize inventory, and surface strategic insights before your teams need to ask for them.
5. Connected Products and IoT
We design and build IoT platforms that turn physical devices into intelligent, connected systems with built-in real-time monitoring, remote management, and condition-based automation.
6. Data Engineering and AI Infrastructure
From data lakes and ETL pipelines to AI-ready cloud architecture, we build the foundation that makes everything else possible, scalable, reliable, and designed to grow with your business.
If you are looking to move from AI experimentation to AI-native operations, let’s talk.